Instrumentation Tool
Pressure & DP Transmitter Total Error Calculator
Your datasheet’s reference accuracy is not the error you get in the field. Add the ambient-temperature and static-pressure effects to find the real total probable error (TPE) at your operating conditions.
Total Probable Error (TPE) Calculator
Enter the three coefficients from your transmitter’s datasheet and your operating conditions. TPE combines them with the standard root-sum-of-squares method: TPE = √(ref² + temp² + static²).
Defaults shown are an illustrative example (an HM31-class 0.075% reference accuracy and ±0.05% span per 100 kPa static effect, with a typical 0.10%/28 °C temperature term). Replace every field with the figures from your own transmitter’s datasheet.
Why The Datasheet Accuracy Is Not Your Installed Accuracy
The big number on a transmitter datasheet, the reference accuracy, is measured under laboratory reference conditions: a stable bench temperature and little or no static line pressure. Your process is not a laboratory. The same cell that holds ±0.075 % of span on the bench sees a hot summer afternoon, a cold winter night, and the full line pressure pushing on both diaphragms at once. Each of those adds its own error on top of the reference figure.
Total probable error, or TPE, is the honest number: the accuracy the transmitter actually delivers once the ambient-temperature effect and the static-pressure effect are added to the reference accuracy. For a typical industrial pressure or differential pressure transmitter, installed performance usually lands somewhere between 0.5 % and 2 % of calibrated span, several times worse than the headline figure. Sizing a control loop, a custody-transfer calculation, or a filter change-out alarm on the headline number alone is how good instruments still disappoint in the field.
The Three Error Terms, And Why Static Pressure Is The DP Trap
Reference accuracy bundles the bench errors a maker is willing to guarantee: linearity, hysteresis, and repeatability, quoted as a percent of calibrated span. It is the floor, not the whole story.
Ambient-temperature effect is the error the electronics and the sensing cell pick up when the surrounding temperature drifts away from the calibration temperature. Datasheets state it per a fixed step, often per 28 °C (50 °F) or per 10 °C, and frequently as two parts, one scaled to span and one to the upper range limit. Scale it to the real ambient swing your installation sees, not the gentle step on the sheet.
Static-pressure effect is the term people forget, and it is the one that bites differential pressure measurement hardest. A DP cell sits with full line pressure on both ports, and that common pressure shifts the zero and the span by a small percentage for every increment of static pressure. On a low DP span riding on a high static line, this term can dwarf the reference accuracy. It is also why you zero a DP transmitter under live line pressure through a three-valve manifold rather than at atmosphere. Our HM31 differential pressure transmitter rates this effect near ±0.05 % of span per 100 kPa, and the high-static HM3051 smart transmitter is rated to 32 MPa line pressure for exactly these duties.
Root-Sum-Of-Squares Vs Worst Case
The three errors rarely peak together and in the same direction, so simply adding them overstates the real-world figure. The industry-standard total probable error combines them statistically, as the square root of the sum of the squares: TPE = √(reference² + temperature² + static²). That is the number the calculator above reports, and it matches the method published by major transmitter makers. The linear sum is also shown as a conservative worst case; reach for it only when a safety or custody calculation demands the pessimistic bound. If one term clearly dominates, the root-sum-of-squares result will sit just above that dominant term, which is a quick sanity check on your inputs.
How To Pull The Three Numbers Off A Datasheet
Reference accuracy is usually the most prominent specification, written as a percent of span or, on smart transmitters, a percent of calibrated span with a turndown qualifier. Watch that qualifier: the headline figure often holds only near full span, and the error grows once you re-range the cell down. Our companion turndown ratio calculator shows how far the reference accuracy degrades at high turndown, and that degraded figure is the one to feed into this tool as the reference term.
The temperature and static-pressure effects live further down the sheet, in the performance or influence-quantity table. Read the per-step basis carefully, since per 10 °C and per 28 °C differ by nearly threefold, and confirm whether the static term is quoted per 100 kPa, per MPa, or per 6.9 MPa (1000 psi). The calculator lets you select each basis so you can enter the numbers exactly as printed, then it scales them to your operating conditions for you.
A Worked Example On A 1.6 MPa Line
Take a DP transmitter with a 0.075 % of span reference accuracy, a temperature effect of 0.10 % of span per 28 °C, and a static-pressure effect of 0.05 % of span per 100 kPa. Install it on a 1.6 MPa line with a 28 °C ambient swing from the calibration temperature. The temperature term stays at 0.10 %. The static term grows to 0.05 % × (1600 kPa ÷ 100 kPa) = 0.80 % of span, and it now dominates. Root-sum-of-squares gives √(0.075² + 0.10² + 0.80²) ≈ 0.81 % of span, more than ten times the headline accuracy. The lesson is blunt: on a high-static line, the static term, not the brochure number, sets your installed accuracy, so match the static rating to the pipe and zero under live pressure.
From Total Error To Calibration Interval
TPE describes the error the day the transmitter is installed. Over months the cell also drifts, and the published stability figure, such as a percent of span per year, eats into whatever margin you have against the loop’s accuracy requirement. A practical calibration interval is the time it takes for TPE plus accumulated drift to approach that requirement. If installed error is already close to the limit, the interval shortens; if you have headroom, it lengthens. Establish the as-found baseline with a proper bench procedure first, covered in our DP transmitter calibration guide, then use this calculator to see how much room the application leaves before the next check is due.
 HM31Differential Pressure TransmitterGeneral-purpose DP for liquids and gases, static to 20 MPa, ±0.05% span per 100 kPa static effect.
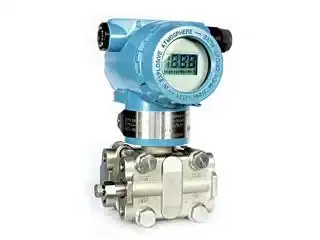 HM3051Smart DP TransmitterHART, ±0.1% accuracy, static to 32 MPa, digital re-ranging for high-static, wide-turndown duties.
 Turndown ratio and accuracy at re-range
 DP transmitter calibration guide
 How a differential pressure transmitter works
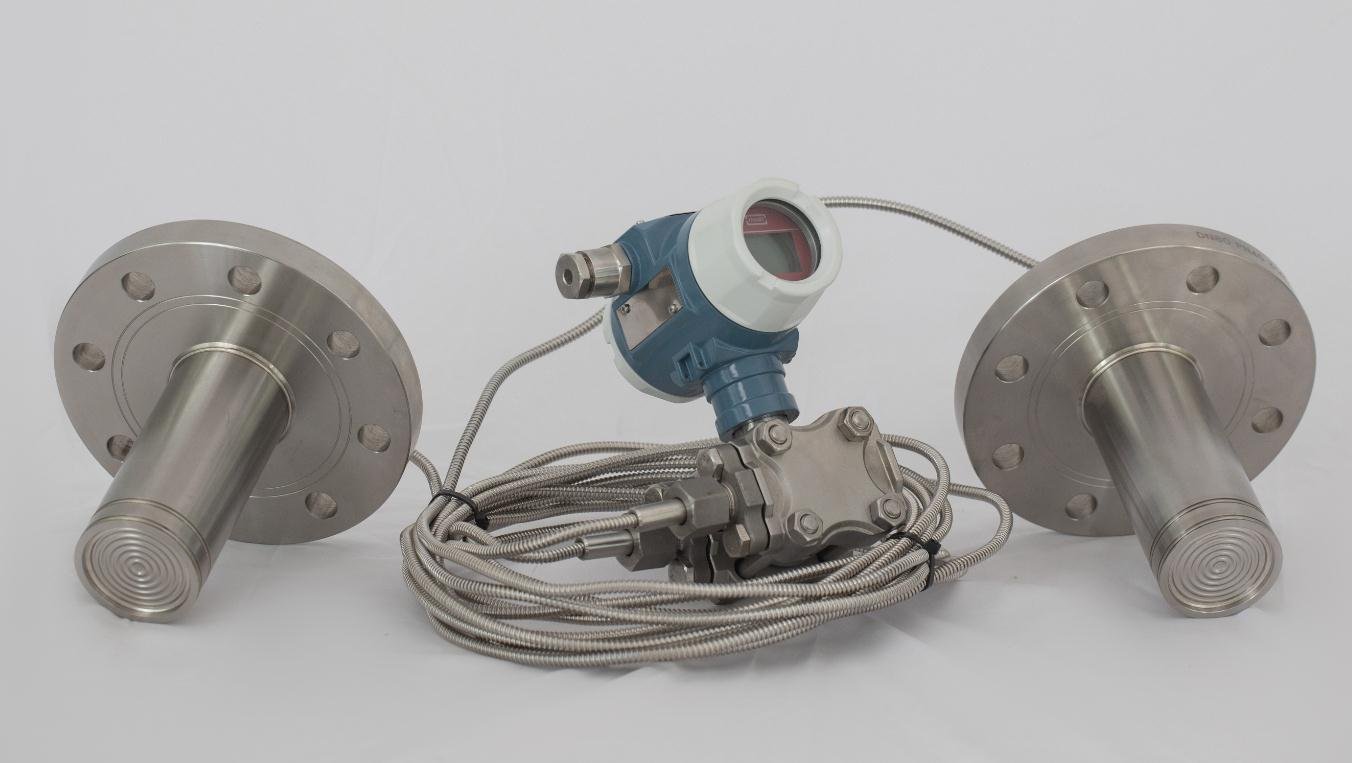 High-temperature DP transmitter
Frequently Asked Questions
What is total probable error (TPE) for a pressure transmitter?
TPE is the installed accuracy of the transmitter once the ambient-temperature effect and the static-pressure effect are combined with the reference accuracy. It is calculated as the root-sum-of-squares of the three terms and is normally several times larger than the headline reference accuracy printed on the datasheet.
Why is my installed accuracy worse than the datasheet number?
Because the datasheet figure is a reference-condition number. In service the transmitter also carries a temperature error from the ambient swing and, for differential pressure, a static-pressure error from the line pressure on both ports. On a high-static line the static term alone can be ten times the reference accuracy, so the total is far higher than the brochure figure.
Should I use root-sum-of-squares or just add the errors?
Root-sum-of-squares is the standard for total probable error because the individual errors seldom peak together and in the same direction, so adding them linearly overstates the real figure. Use the linear sum only when a safety or custody calculation needs a conservative worst-case bound. The calculator reports both.
Does static-pressure effect apply to gauge and absolute transmitters too?
It is mainly a differential-pressure concern, because a DP cell sees the full line pressure as a common-mode load on both ports. Gauge and absolute transmitters measure against atmosphere or vacuum, so they have no separate static-pressure term; for them, set that field to zero and size TPE from the reference accuracy and temperature effect alone.
How does TPE relate to calibration frequency?
TPE is the starting error at installation; long-term drift then accumulates on top of it. The calibration interval is roughly the time for TPE plus drift to approach the loop’s accuracy requirement, so a tight application with little margin needs more frequent checks than one with generous headroom.